Accordions Enhancement
The accordions on this page are set to be expanded on page load. An optional button has also been added that allows for toggling of all the individual accordions in a single click - useful for extremely long accordions.
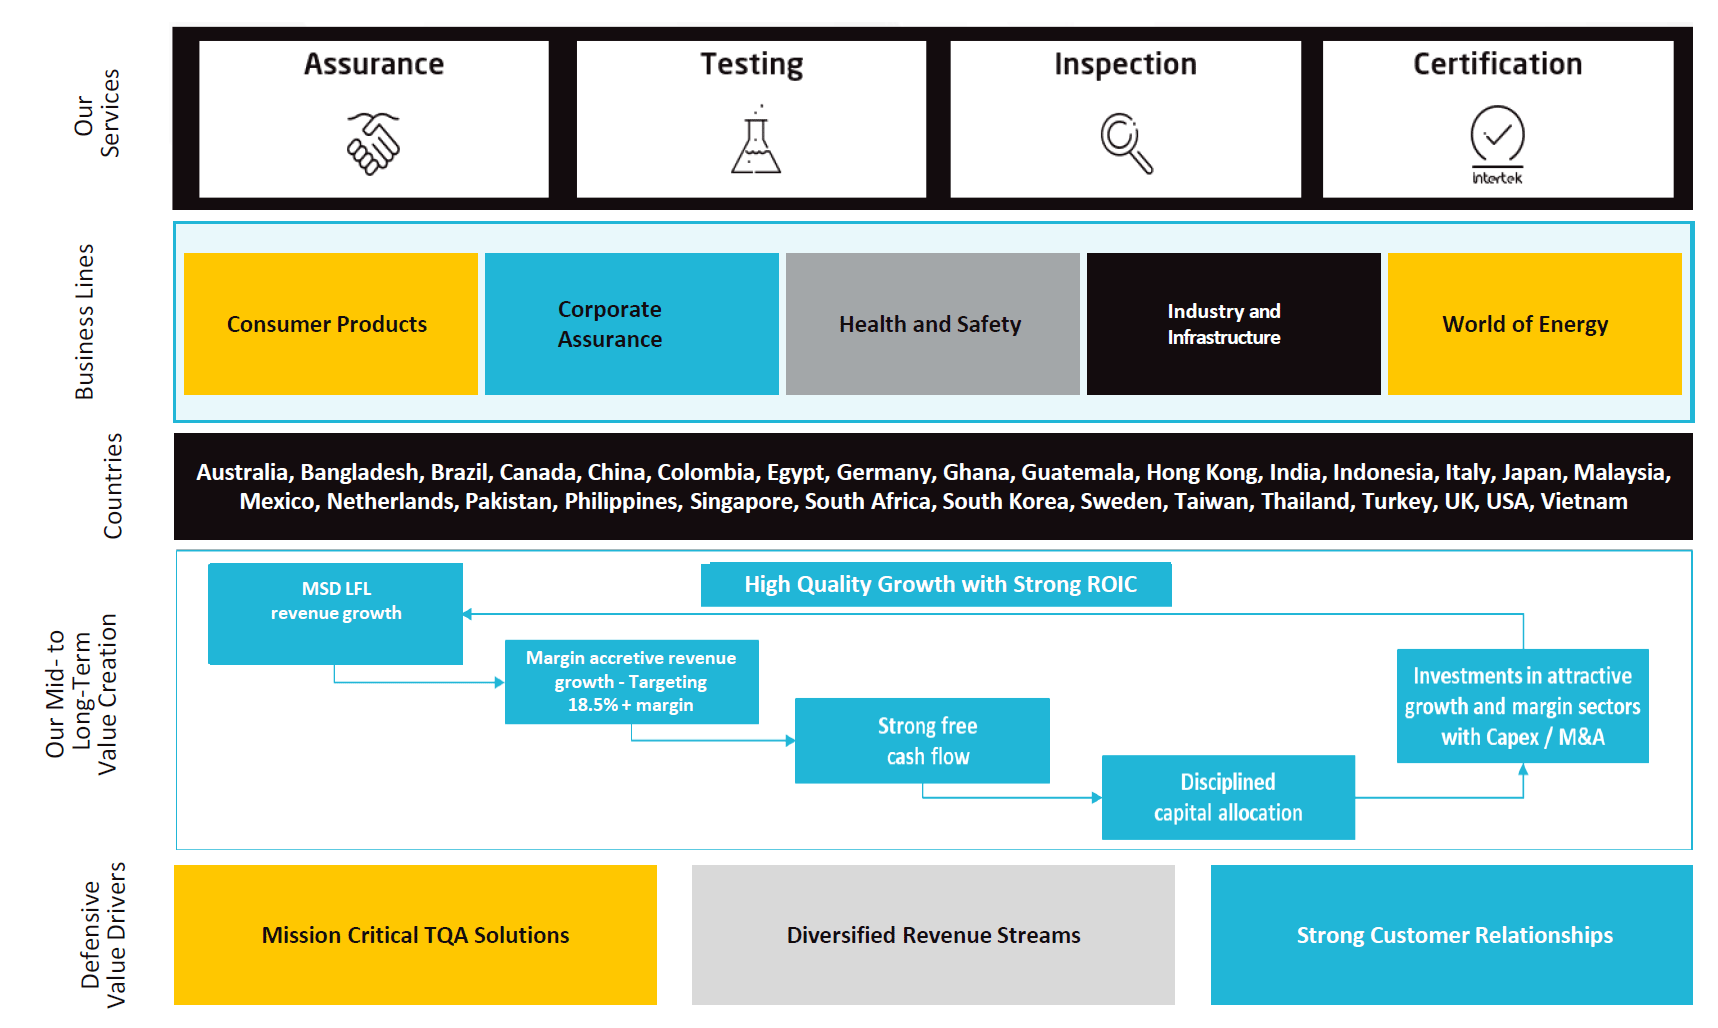
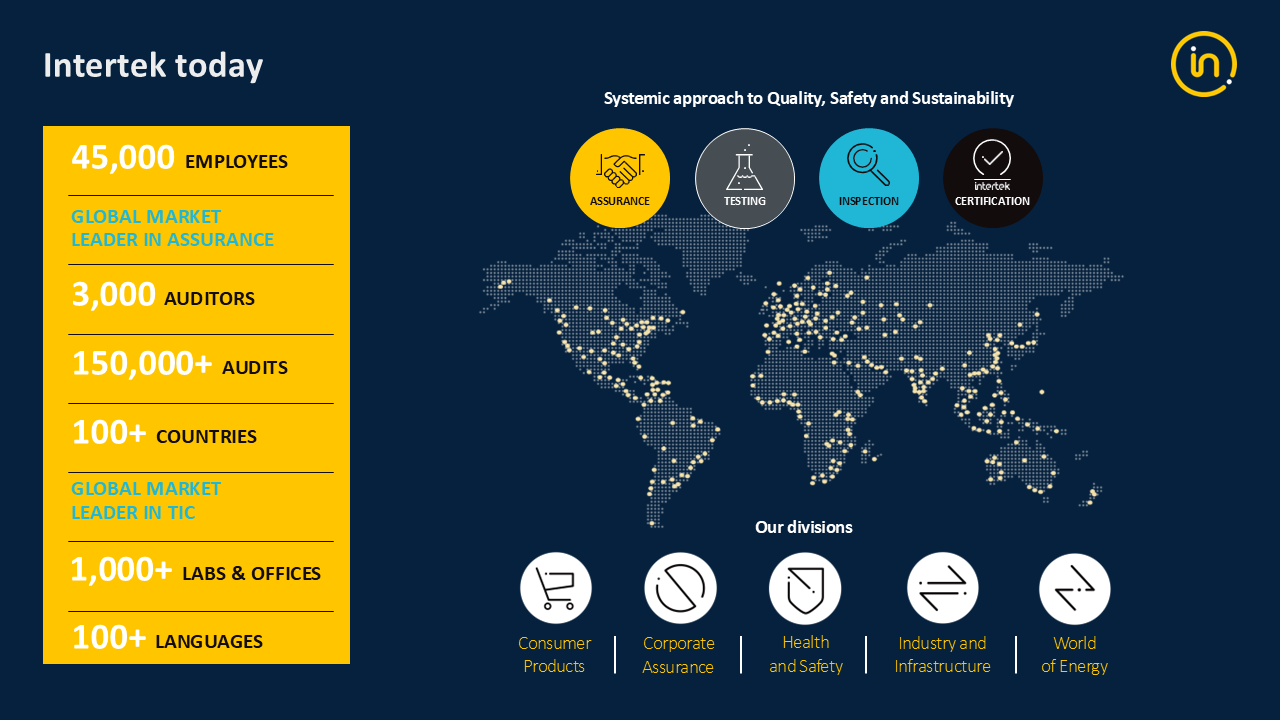
We operate in more than 100 countries in a variety of markets and industries, ranging from consumer goods to the energy sector, and we deliver a wide range of ATIC services.
Our Science‐based Customer Excellence is at the core of our competitive advantage and enables us to deliver mission critical services for our clients
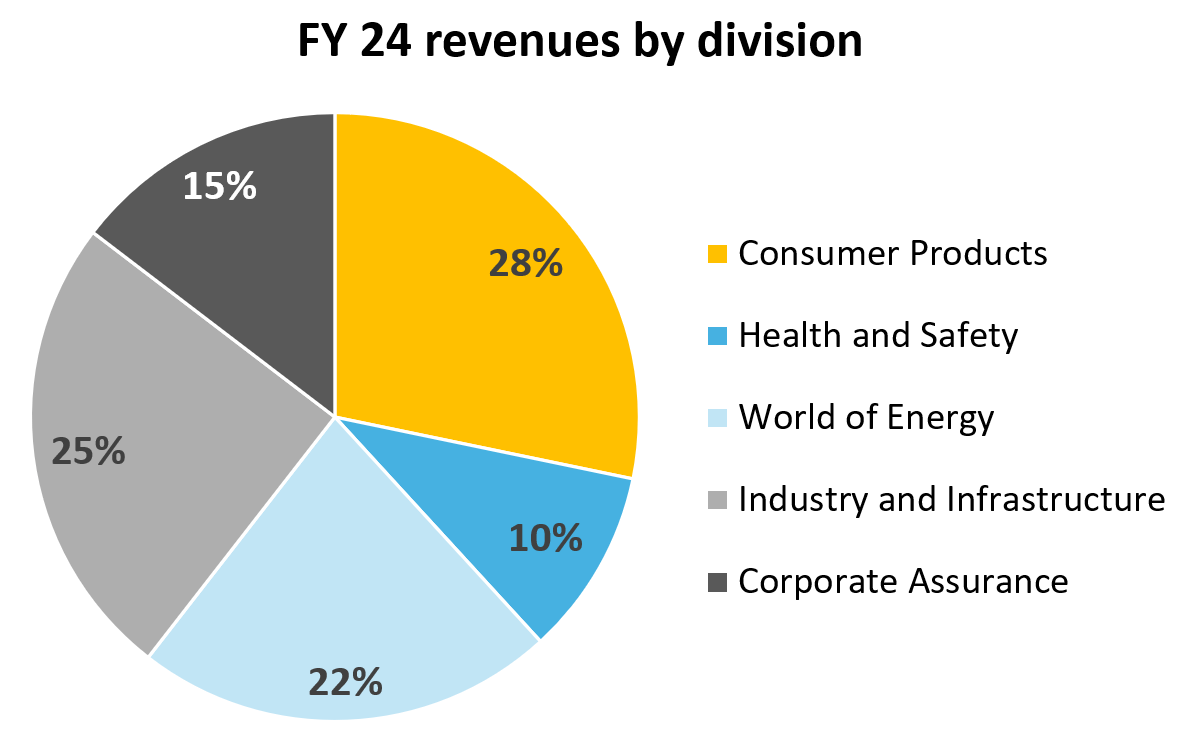
Consumer products (28%) is our largest division, followed by Industry & Infrastructure (25%) and World of Energy (22%). Corporate Assurance (15%) and Health & Safety (10%) and account for the remaining 25%.
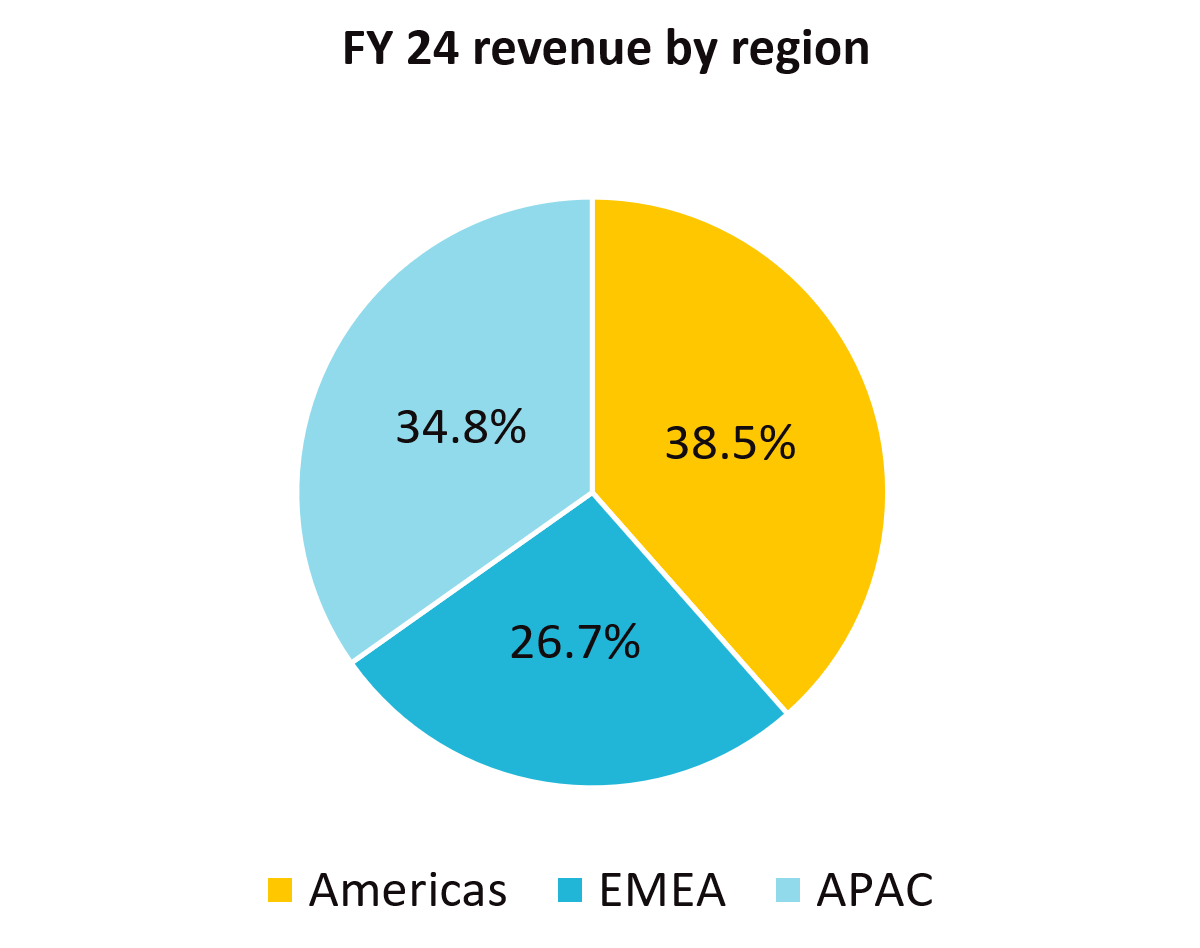
As a global company, we have operations in the Americas (38.5%), APAC (34.8%) and EMEA (26.7%).
With over 45,000 employees spanning over 100 countries, Intertek is a truly global company. We cover all aspects of the value chain through our 5 divisions with over 1,000 labs and offices.
The split of our revenue continues to evolve with Assurance making up a greater percentage. Testing remains our largest service at 46% of revenue.
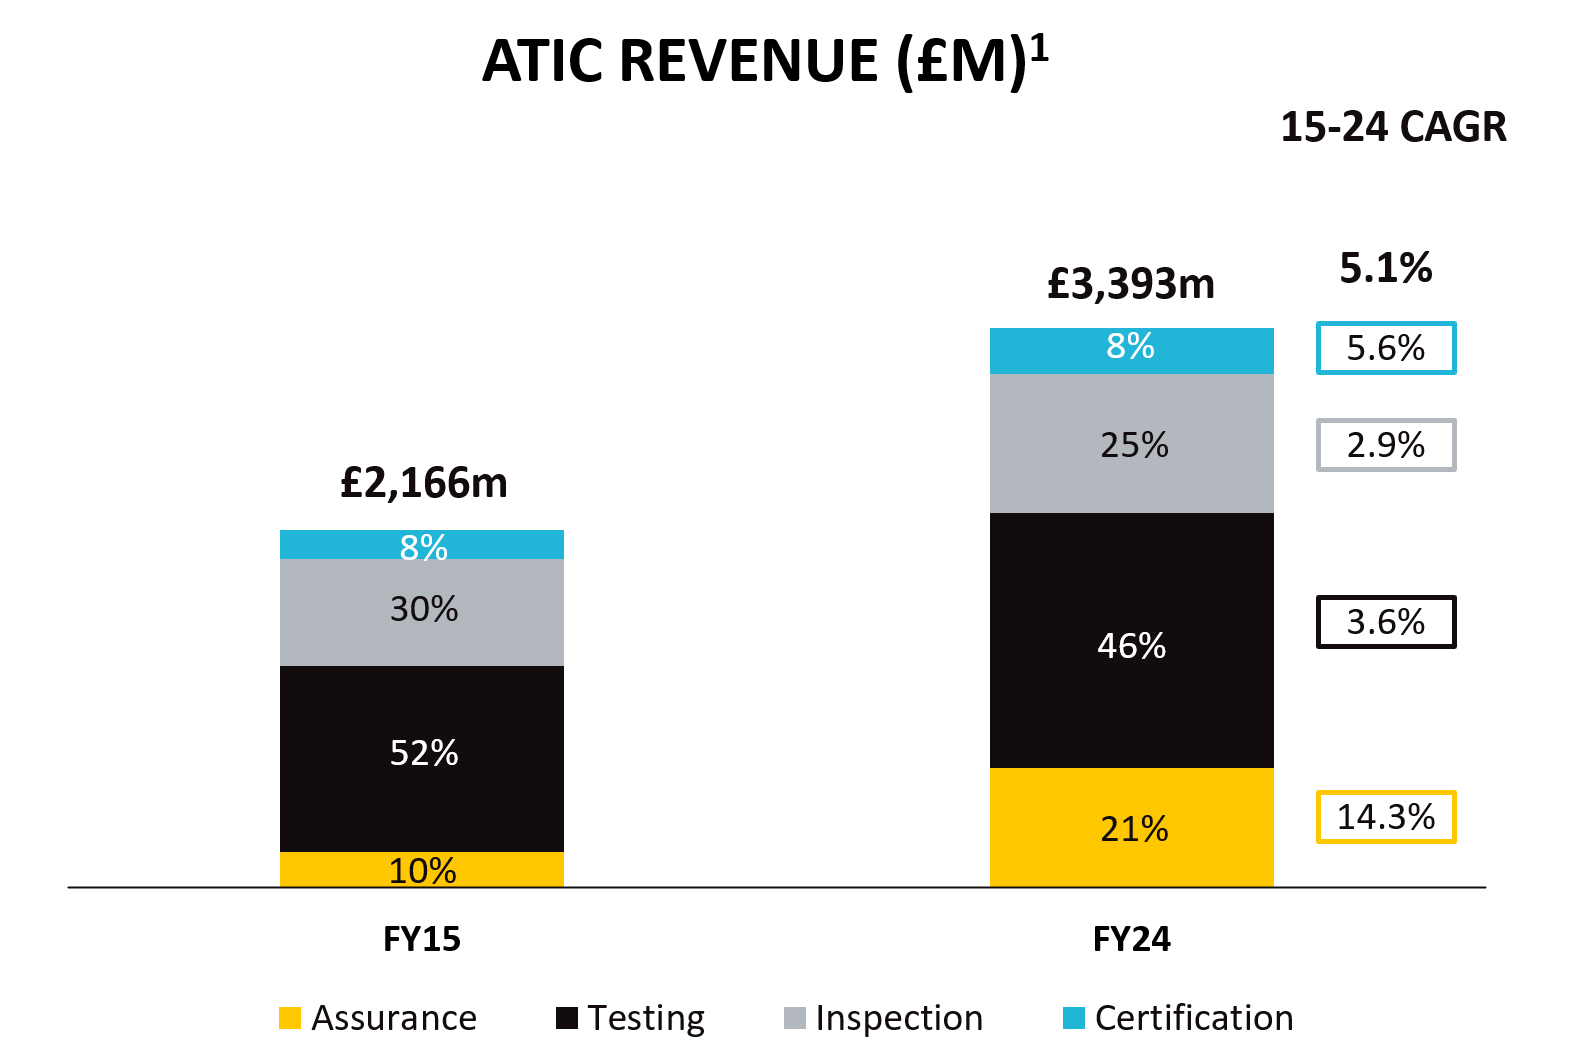
Note: (1) At actual rates
We work with more than 400,000 clients around the world and enjoy long-lasting relationships based on our superior customer service.
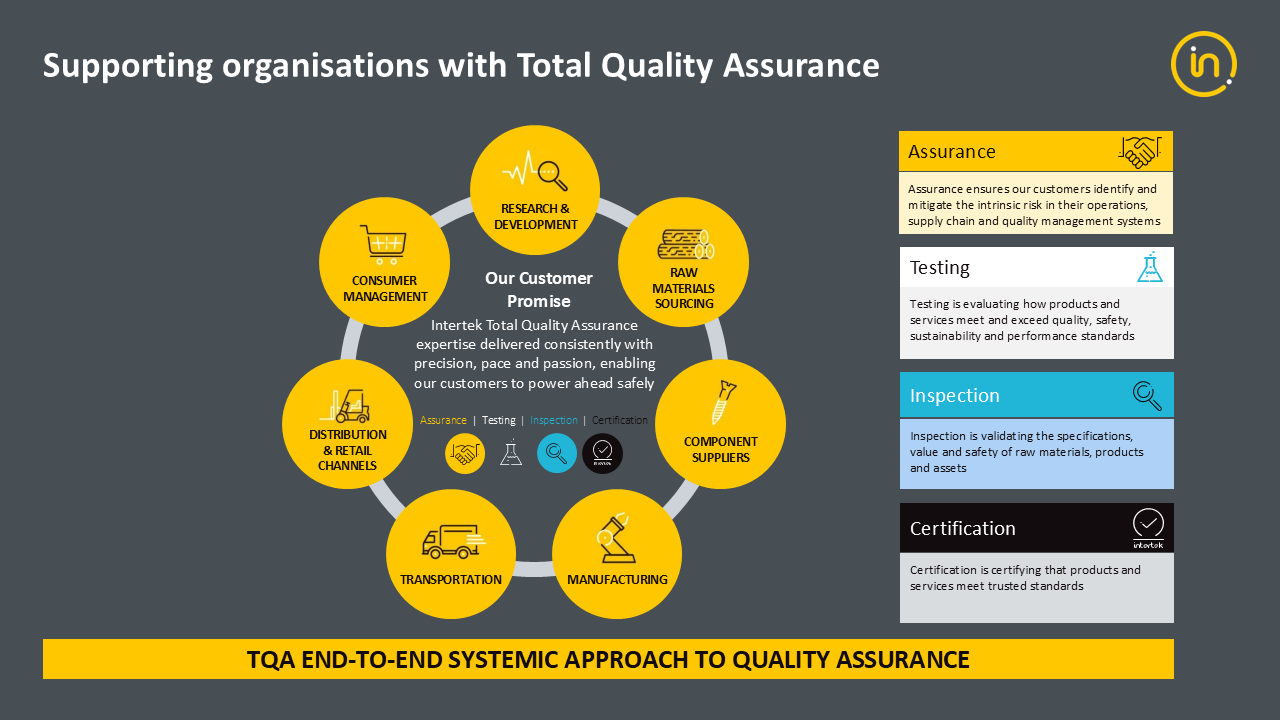
We provide independent quality assurance services that are mission critical for our clients. We have a strong technical expertise in all the sectors we operate in and when combined with our passionate and entrepreneurial culture, this enables us to support the growth agenda of our clients in an ever-changing and more complex operating environment.
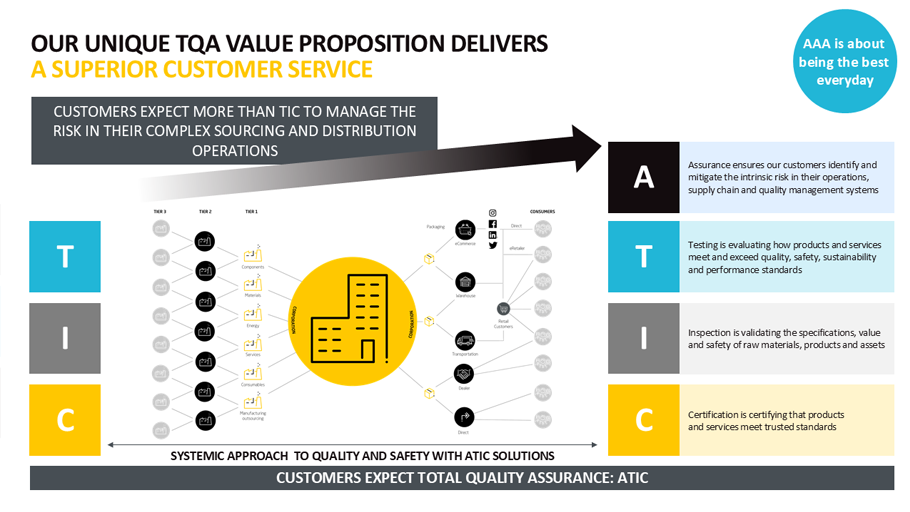
We provide ATIC solutions at every single stage of our clients’ operations. This is what we mean by Total Quality Assurance.
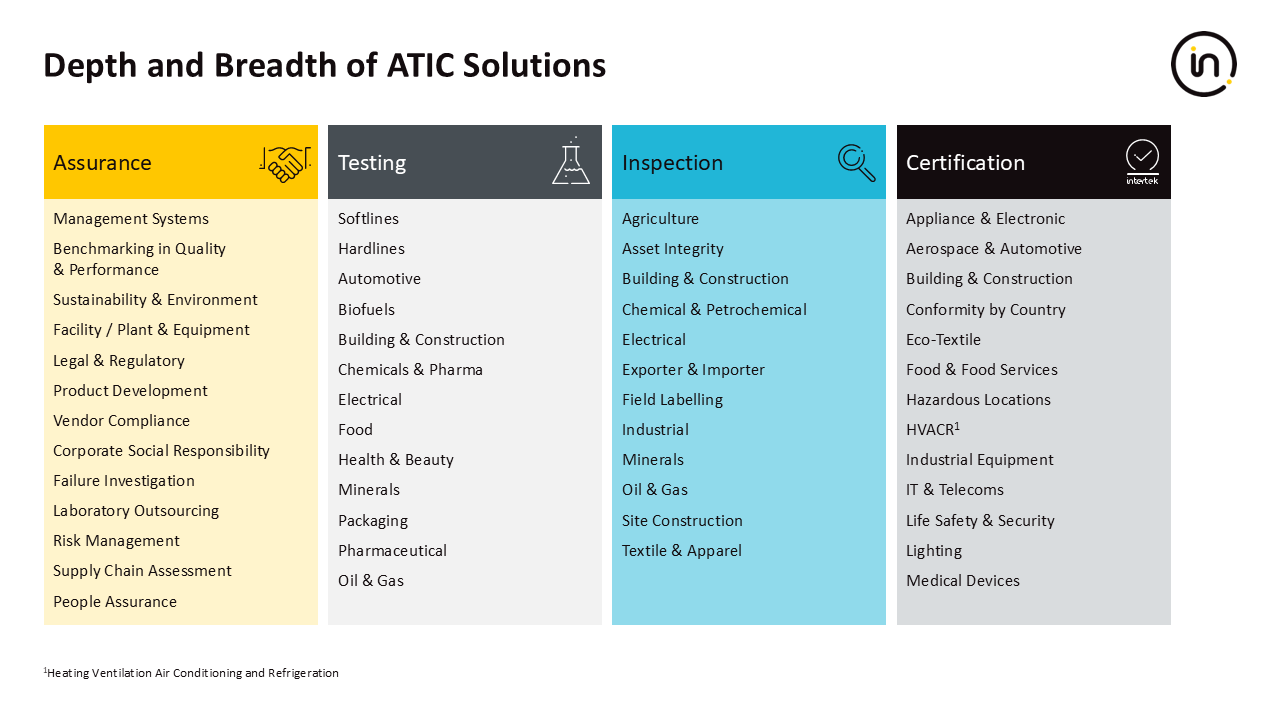
Our ATIC Solutions cover a wide range of industries across various points of the supply chain.
Intertek’s approach to being a high-performance organisation is through energising our colleagues to take the company to new heights. We put people at the heart of our growth strategy, our 10X culture is our DNA.
We have made significant progress on the metrics that define a high-performance organisation; revenue per employee, profit per employee, cash flow per employee, employee turnover, engagement.
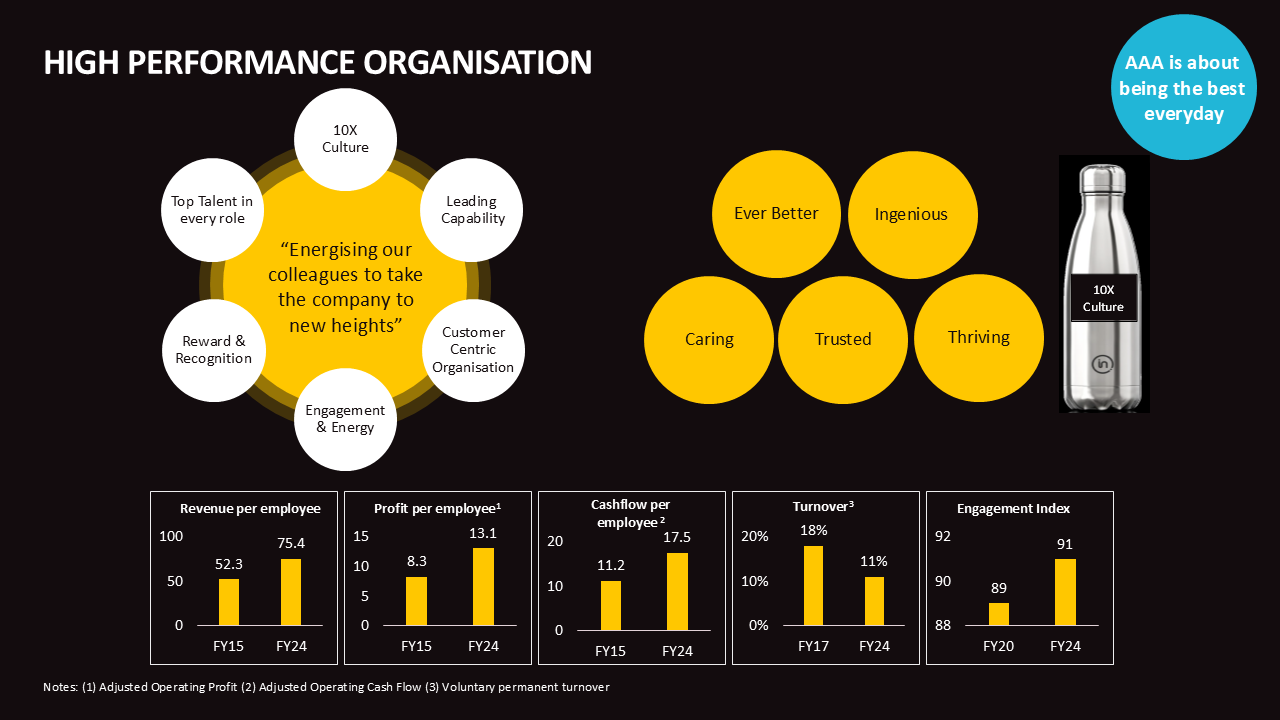
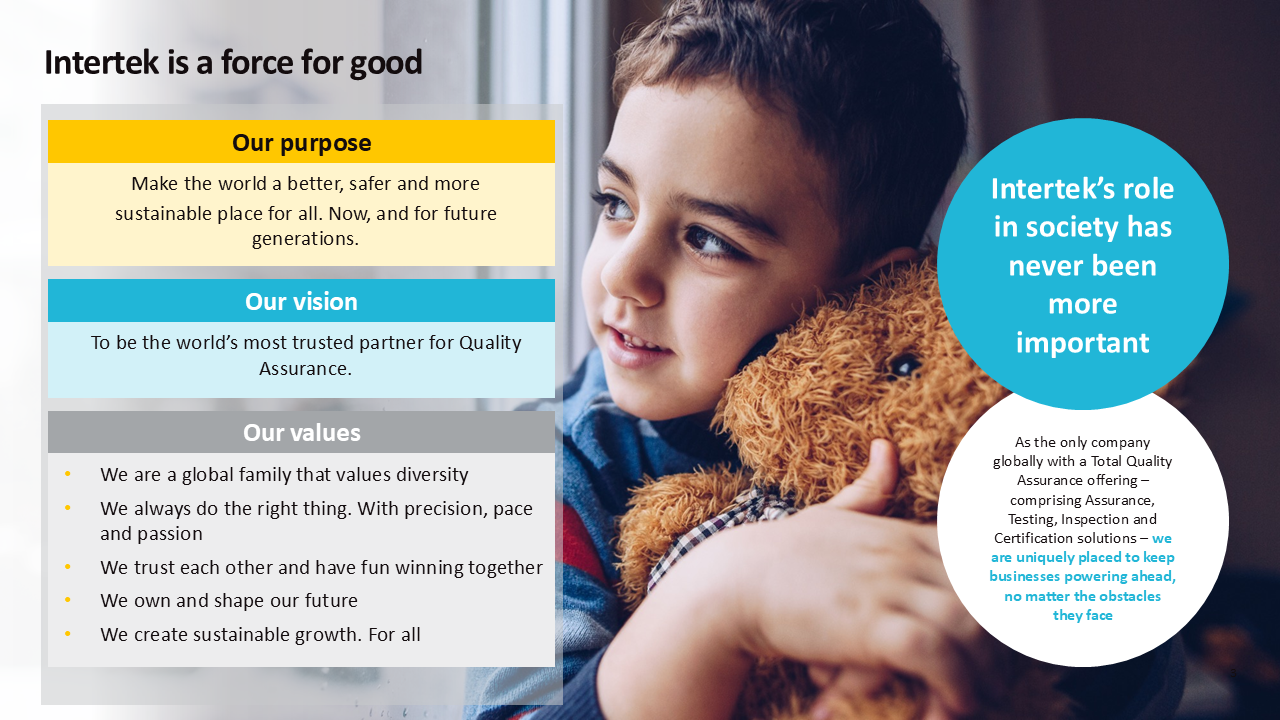
Intertek’s goal is to be the most trusted partner for Quality Assurance. This is weaved throughout our values of doing the right thing, trust and have fun winning, creating and shaping our own future and ultimately creating sustainable growth for all.
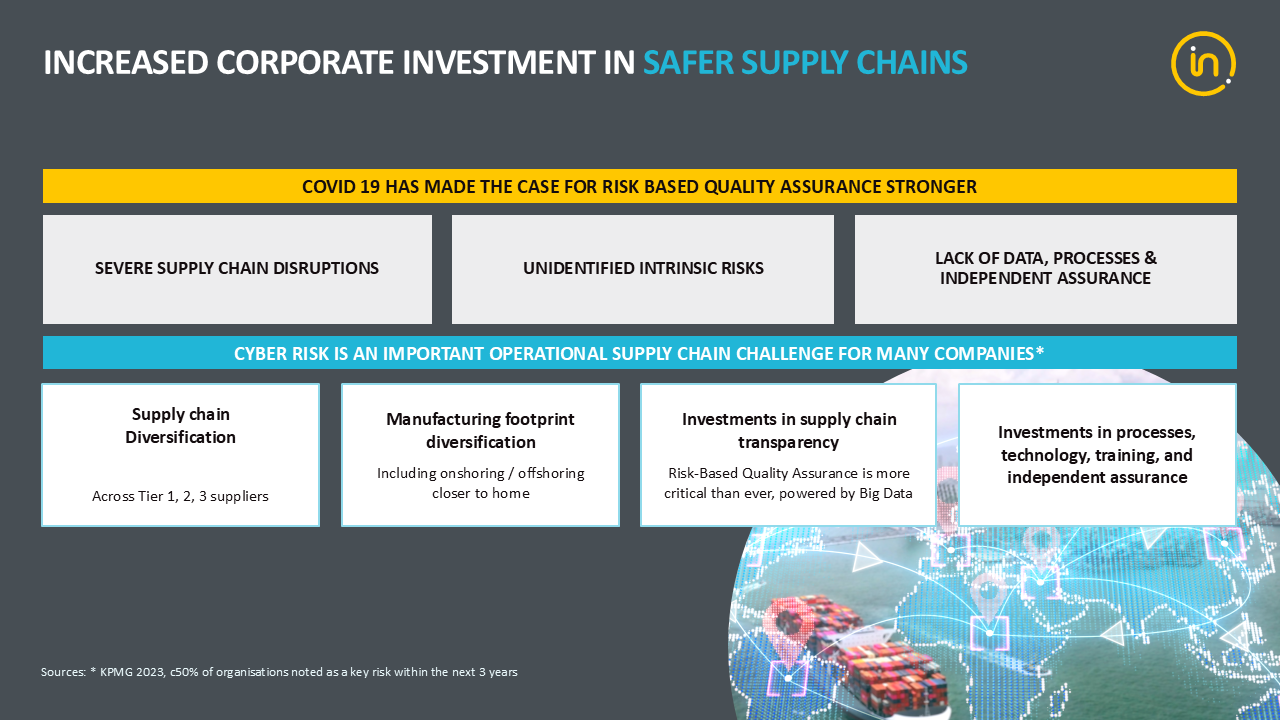
Assurance is the assessment of quality, safety and sustainability processes within company supply chains. With growing complexity in their nature, we provide an audit of company supply chains to identify and eliminate risks. This is done using real-time data which enables companies to detect issues instantly.
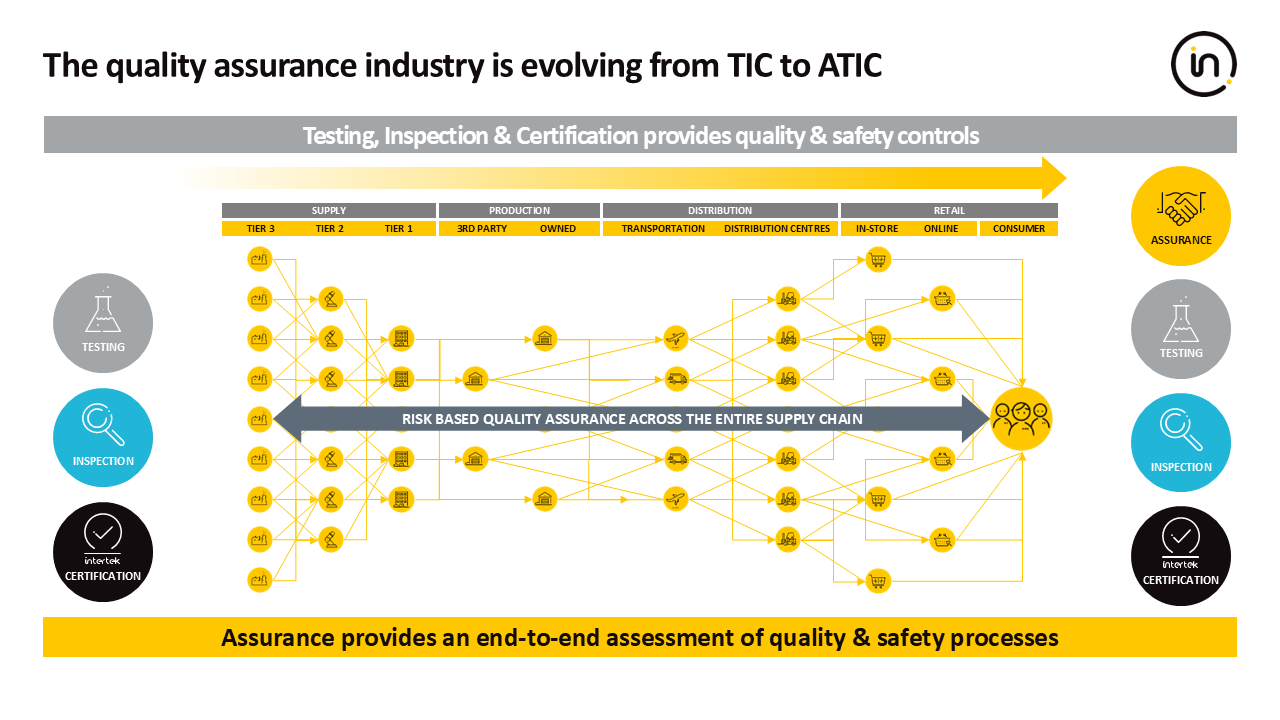
Covid-19 highlighted the fragility of global supply chains and the unidentified risks within them. As such, companies have been investing more in securing their supply chains, ensuring diversification. In addition, there has been increased investment in data protection, training and independent assurance.
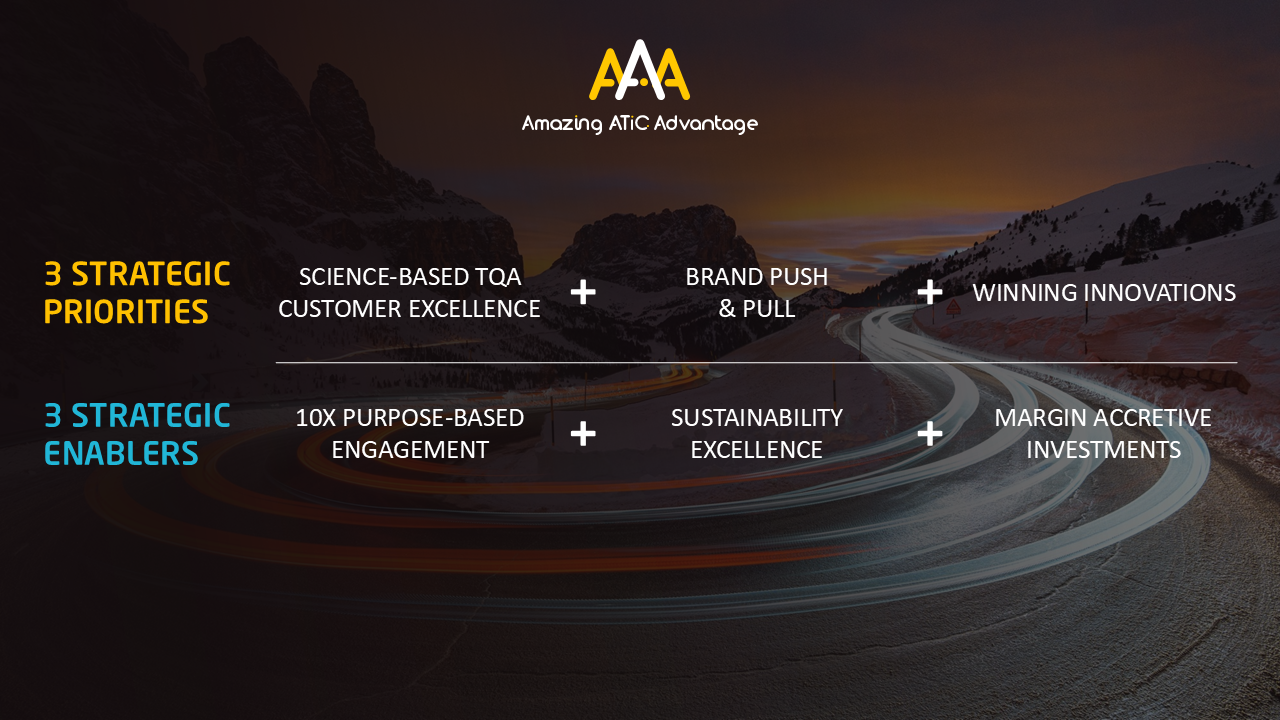
In 2023, as part of our Capital Markets event in London we launched our AAA growth strategy. The idea behind it was to deliver AAA value for all stakeholders and be the most trusted partner for Total Quality Assurance. Our aim was to deliver MSD LFL revenue growth at CCY, margin accretive revenue growth (18.5%+ margin target, announced at our FY24 results), strong FCF, and disciplined capital allocation in high growth and high margin sectors.
The strategy is on track and in FY-24 we delivered MSD LFL revenue growth, strong FCF and margin performance and have increased our dividend payout policy to c.65%.
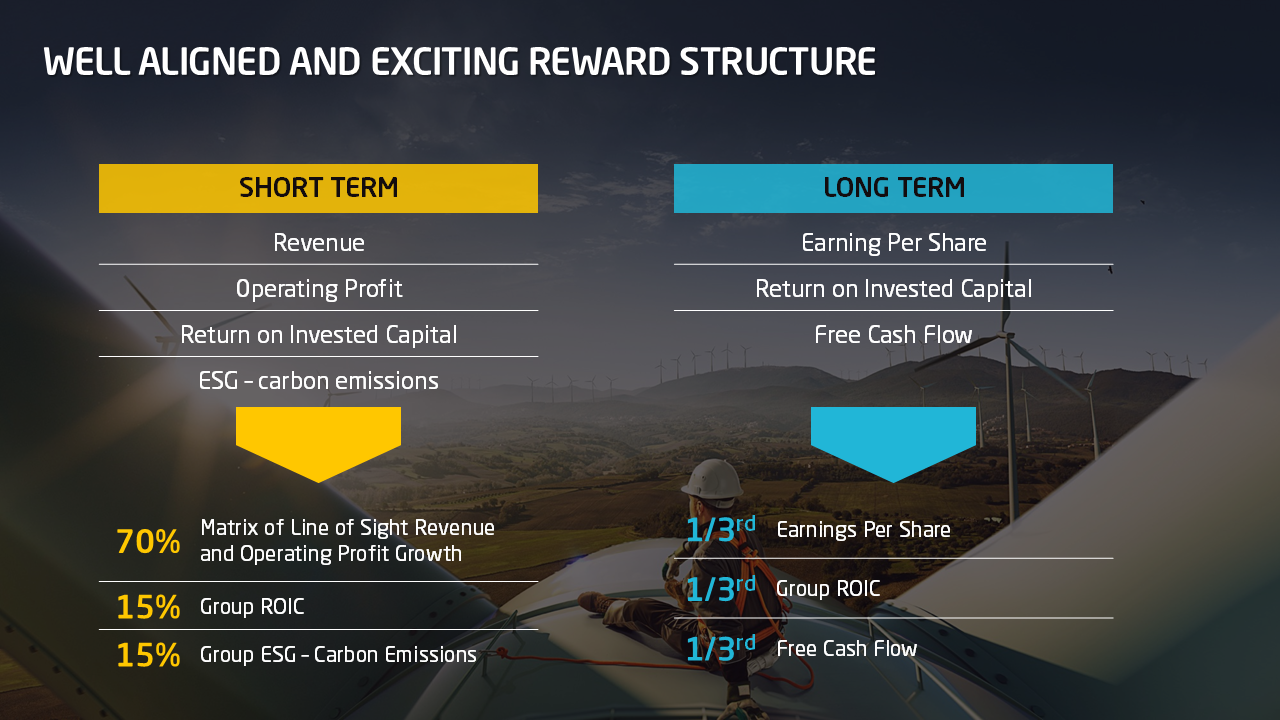
To better align management priorities with that of stakeholders, incentives are aligned to short-term and long-term financial and sustainability metrics.
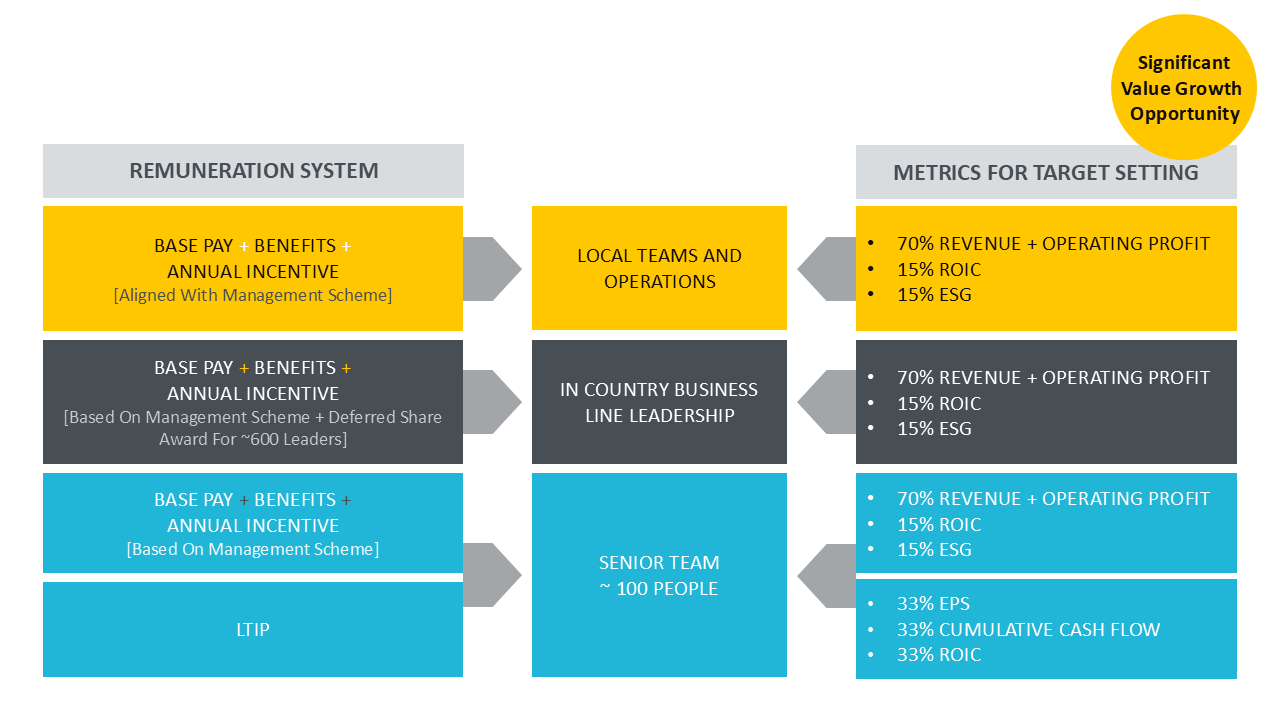
The reward structure is broken down that 70% of the short-term incentive is on a line-of-sight matrix of Revenue and Operating Profit while the balance is split between Group ROIC and Group ESG metrics. The long‐term incentive performance share program is based on a 3‐year performance cycle with a 2 year post vesting holding period. This is based equally on EPS, ROIC and FCF. We believe that having long-term incentives ensures the alignment with all stakeholders.
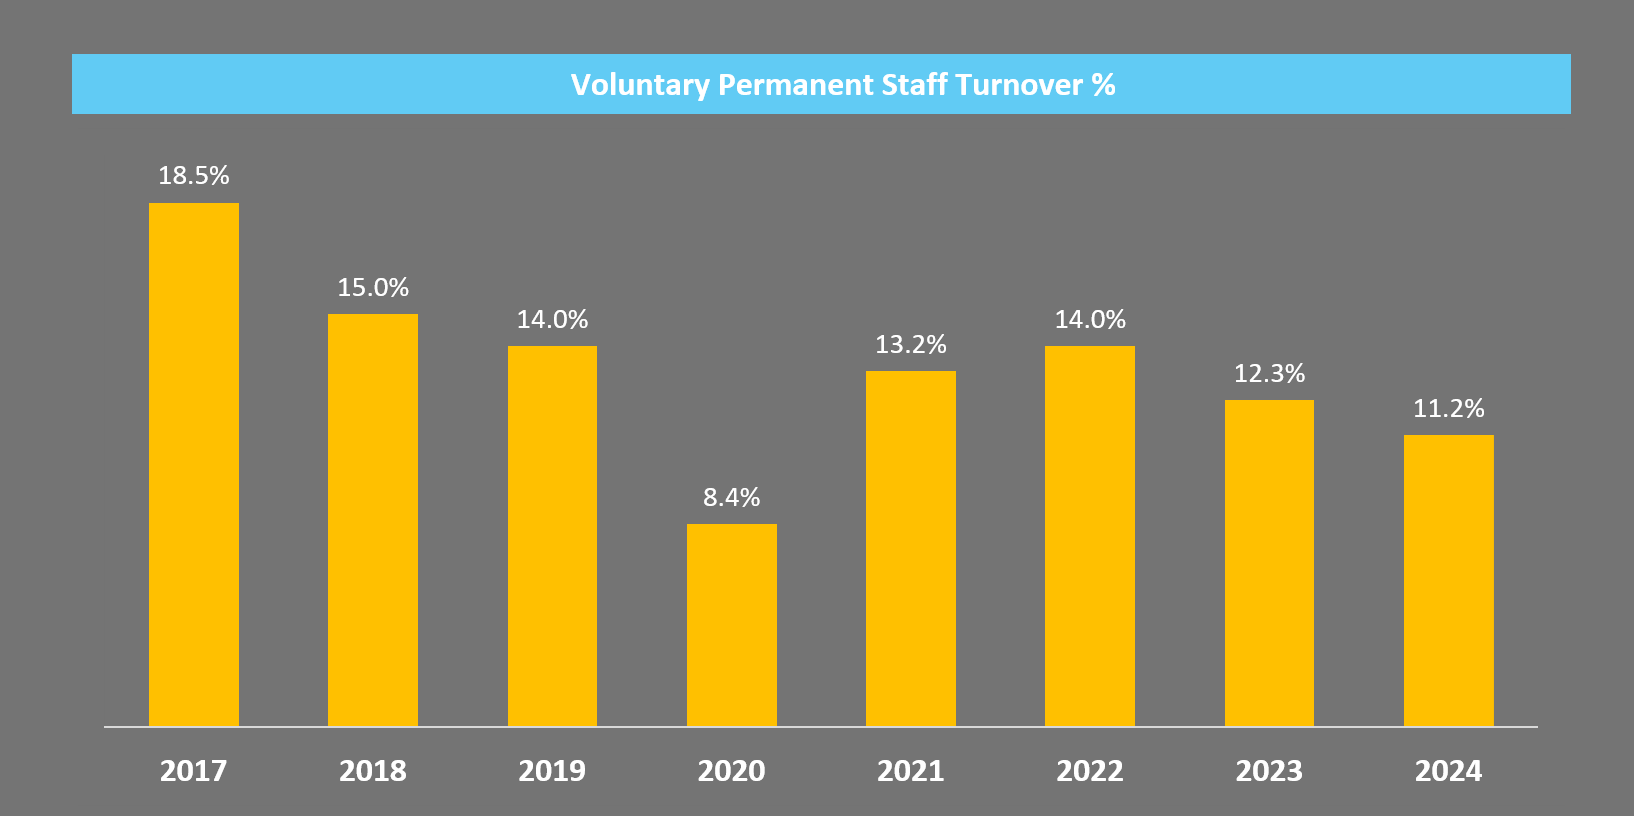
Since launching our people strategy in 2016, our voluntary employee turnover has come down from 18.5% in 2017 to 11.2% in 2024.